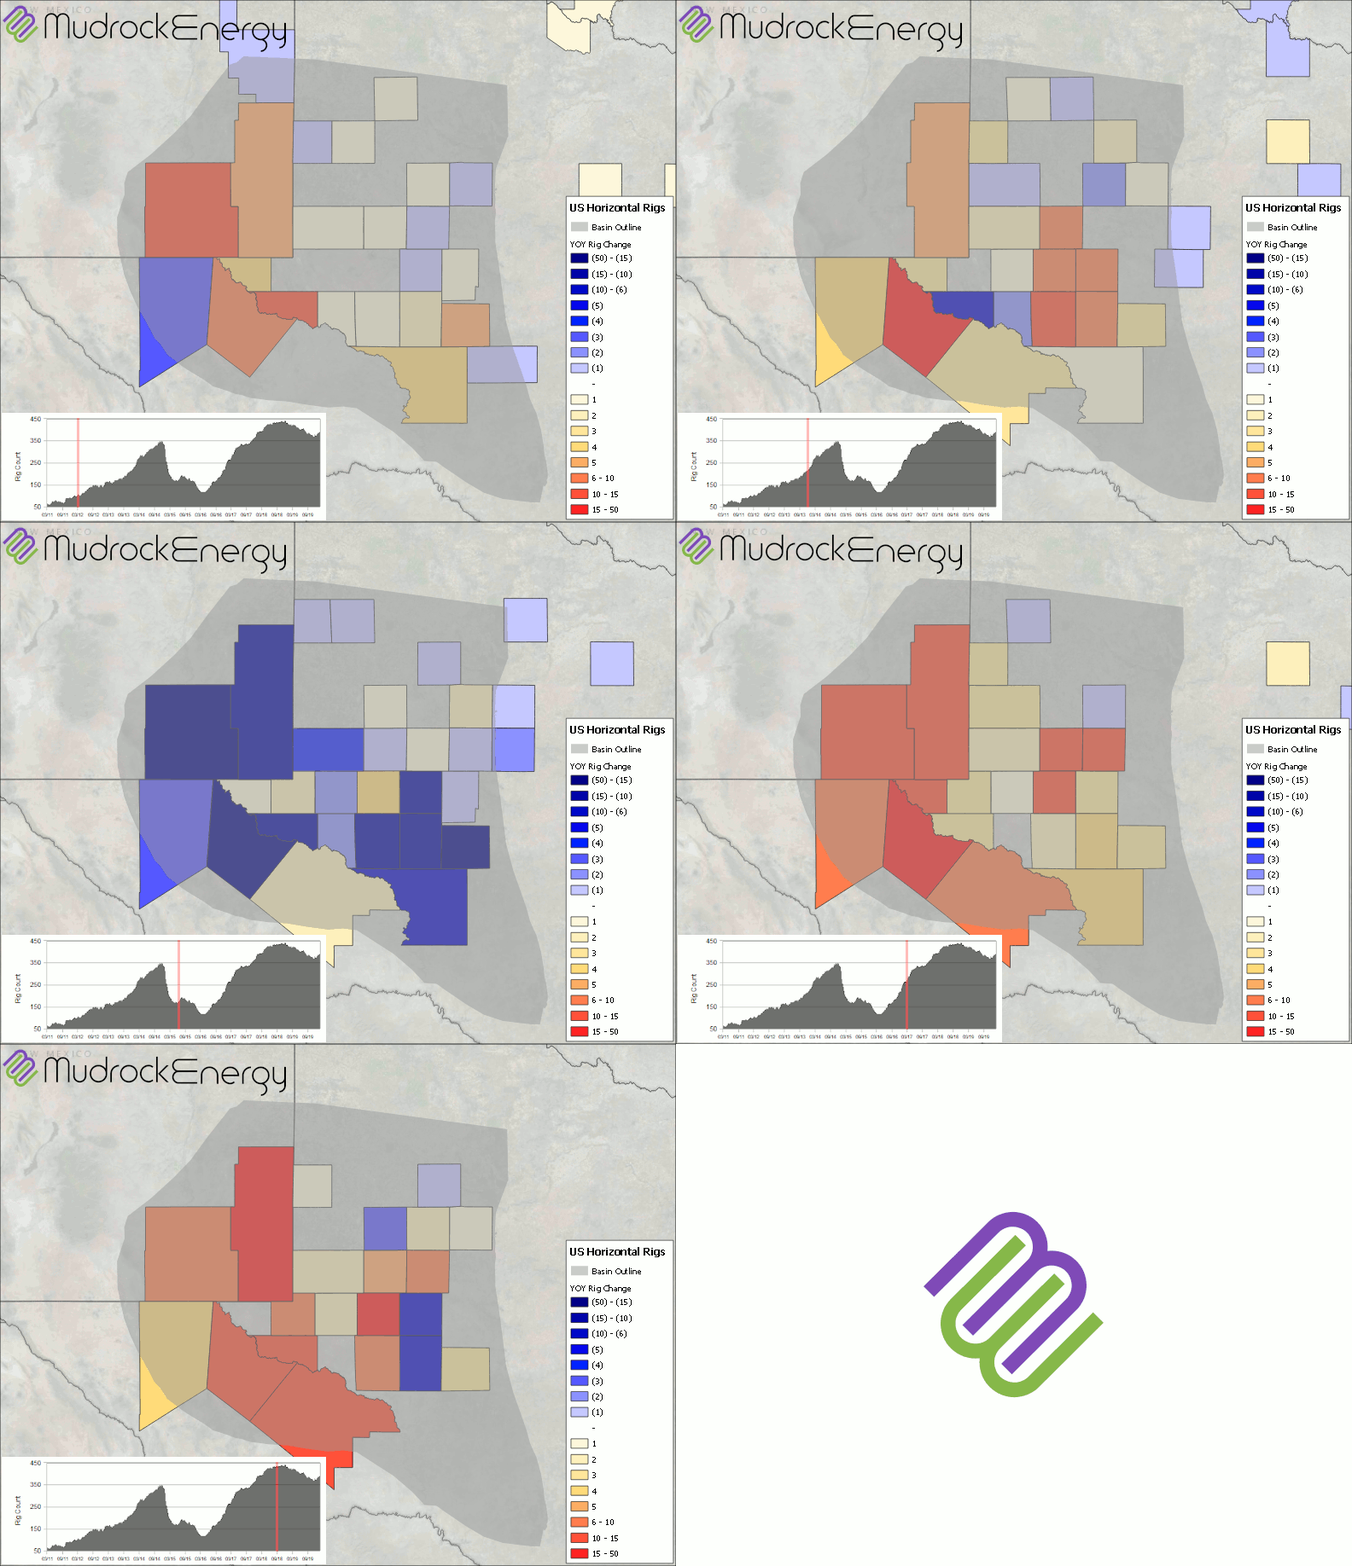
Today’s post is the follow up to the Permian horizontal rigs over time. Instead of the number of horizontal rigs, the maps represent year over year change by county. The general trends show the growth up through 2014, the drop in 2015-2016, and the resurgence in 2017. Looking closer, it is interesting to see continued growth in the Delaware Basin counties while rig growth in other counties primarily in the Midland Basin slow and start to decline in 2018. Mid-year 2019, the growth slows and declines across the majority of the Permian.

Maps created with data sourced from Baker Hughes.